TPJ March 2022 Editor's choice by Leonie Verhage
Liu, Z., Wang, J., Zhou, Y., Zhang, Y., Qin, A., Yu, X., Zhao, Z., Wu, R., Guo, C., Bawa, G., Rochaix, J.-D. and Sun, X.
Identification of novel regulators required for early development of vein pattern in the cotyledons by single-cell RNA-seq
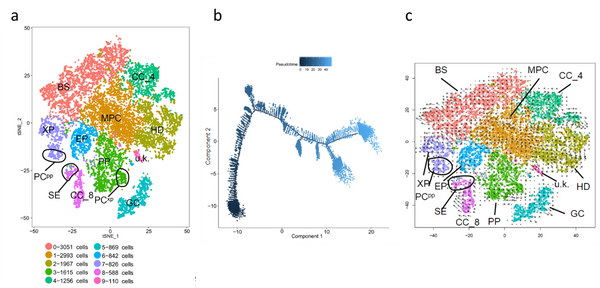
Figure. Different methods to analyze scRNAseq data. a) cells can be clustered based on transcriptome similarity using t-SNE. CC(_4 and _8): two clusters identified as companion cells; PP: phloem parenchyma; GC: guard cells; BS: bundle sheath cells; XP: xylem parenchyma; EP: epidermis; HD: hydathode; MPC: mesophyll cells. b) Analysis of the temporal and spatial distribution of cells by pseudotime analysis: distribution of cells of all clusters on the pseudotime trajectory. c) RNA velocity superimposed on the t-SNE scatter plot. The direction of state transitions is indicated by the vectors (arrows) and the extent of change in RNA dynamics by their lengths. Long arrows indicate that cells have either initiated or terminated the transcription of many different genes, while short or no arrows indicate cells with small changes. Figure adapted from Liu et al. 2022).
Single but not alone: the transcriptomes of 14.000 single cells from developing cotyledon veins
Over the last few years, single-cell RNAseq (scRNAseq) has taken flight: the first study reported the transcriptome of one cell, while recent studies analyzed hundreds or thousands of single cells in parallel. By sequencing many single cells from a differentiating tissue, it is possible to identify different cell types based on transcriptome similarity and order them over a developmental trajectory. In issue 110:1 of The Plant Journal, Zhinxin Liu and colleagues report on the sequencing of the transcriptomes of more than 14.000 individual cells from developing cotyledons to better understand the early development of vein patterns in these organs. Let’s take a closer look at the methods they used to analyze their dataset.
Datasets from scRNAseq have as many dimensions as the number of cells sequenced. Dimensionality reduction is used to cluster cells based on transcriptome similarity. Principal Component Analysis (PCA) is often used for quality control of RNAseq data, but the linear nature of the algorithm isn’t ideal for capturing the non-linear structure of scRNAseq data. Instead, t-distributed Stochastic Neighbor Embedding (t-SNE) and Uniform Manifold Approximation and Projection (UMAP) are more commonly used. Both are non-linear algorithms that translate high-dimensional data into a 2D or 3D scatter plot, similar to a PCA plot. Each cell is represented by a dot, and cells with similar expression values end up closer to each other. With t-SNE, Liu et al. detected 10 different cell clusters (Figure a). To identify which cell type was represented by each cluster, they surveyed the literature for cell-type-specific marker genes for the different types of vascular tissue and determined in which cluster these genes were expressed. They assigned 9 clusters to 8 different cell types. Two clusters expressed marker genes for companion cells. One cluster did not show expression for any of the known marker genes and was termed ‘unknown’.
Individual cells within a cell population undergoing differentiation are not completely synchronized. An scRNAseq dataset is a snapshot; gene expression might seem highly variable between individual cells of the same population. Therefore, single-cell expression data is often analyzed over pseudotime: a measure of how much a cell has progressed through a process such as cell differentiation. To study pseudotime, the authors used Monocle, an analysis toolkit that was specially developed for scRNAseq data. The pseudotime analysis showed that all cells could be ordered along a main developmental trajectory (Figure b). Among the marker genes, the expression levels of several transcription factors, such as BZIP9 and SIEVE ELEMENT OCCLUSION B (SEOB) were highest at the beginning of pseudotime. This suggests that these transcription factors are important at the early stages of vein development in cotyledons. Expression of genes involved in the differentiation of the companion cells, the phloem, and the sieve elements were induced later during the pseudotime trajectory.
RNA velocity analysis is a method to predict how fast and into which cell type a cell is changing by predicting its future gene expression. With standard scRNAseq protocols, both the unspliced pre-mRNA and the spliced mature mRNA are measured. By assuming a constant rate of transcription, splicing, and degradation of the mature mRNA, the future expression can be predicted. The difference between the future and the current expression gives a metric that describes how the gene expression is changing. RNA velocity is often visualized by superimposing vectors (arrows) onto the cells in t-SNE or UMAP scatter plots. The direction of the arrows shows in which direction a cell is changing. The length of the arrow represents the speed at which this change is occurring. The authors analysed RNA velocity using the software package velocyto. They found that bundle sheath cells, xylem parenchyma cells, and one of the clusters representing companion cells showed large changes (represented by long arrows), which is typical for cells that are differentiating rapidly (Figure c).
The authors used their data to identify new marker genes for the different cell types that they could distinguish. Marker genes are highly useful when studying cell and tissue differentiation, but up until now, only 1-4 marker genes were known for the different cell types of vascular tissue. The new marker genes will be useful to further dissect the mechanism that regulates the development of vascular tissues.